
The Hurricane WRF (HWRF) has been the US operational hurricane forecast model since 2007. The Hurricane Forecast and Analysis System (HAFS), based on the GFDL Finite-Volume Cubed-Sphere Dynamical Core (FV3), a scalable and flexible dynamical core, is the likely candidate to replace the operational HWRF. HAFS is the focus of a Unified Forecast System - Research to Operations (UFS-R2O) hurricane modeling project and the next generation hurricane forecast system. For the DTC Visitor Project, my study used satellite imagery to evaluate the HWRF and HAFS model forecasts. The tropical cyclone’s (TC) track and max wind of the models have been extensively evaluated, so to go beyond the track and max wind, we conducted a physics process-based evaluation of the hurricane vortex structure and size using the Geostationary Operational Environmental Satellites—R Series (GOES-R) data, which has global coverage, and visible and infrared bands for hurricane observing. The goal was to compare the model-generated synthetic satellite imagery to the observed satellite imagery to see how realistically they can be simulated and what systematic biases exist, thereby providing insight for model developers to further improve the model performance.
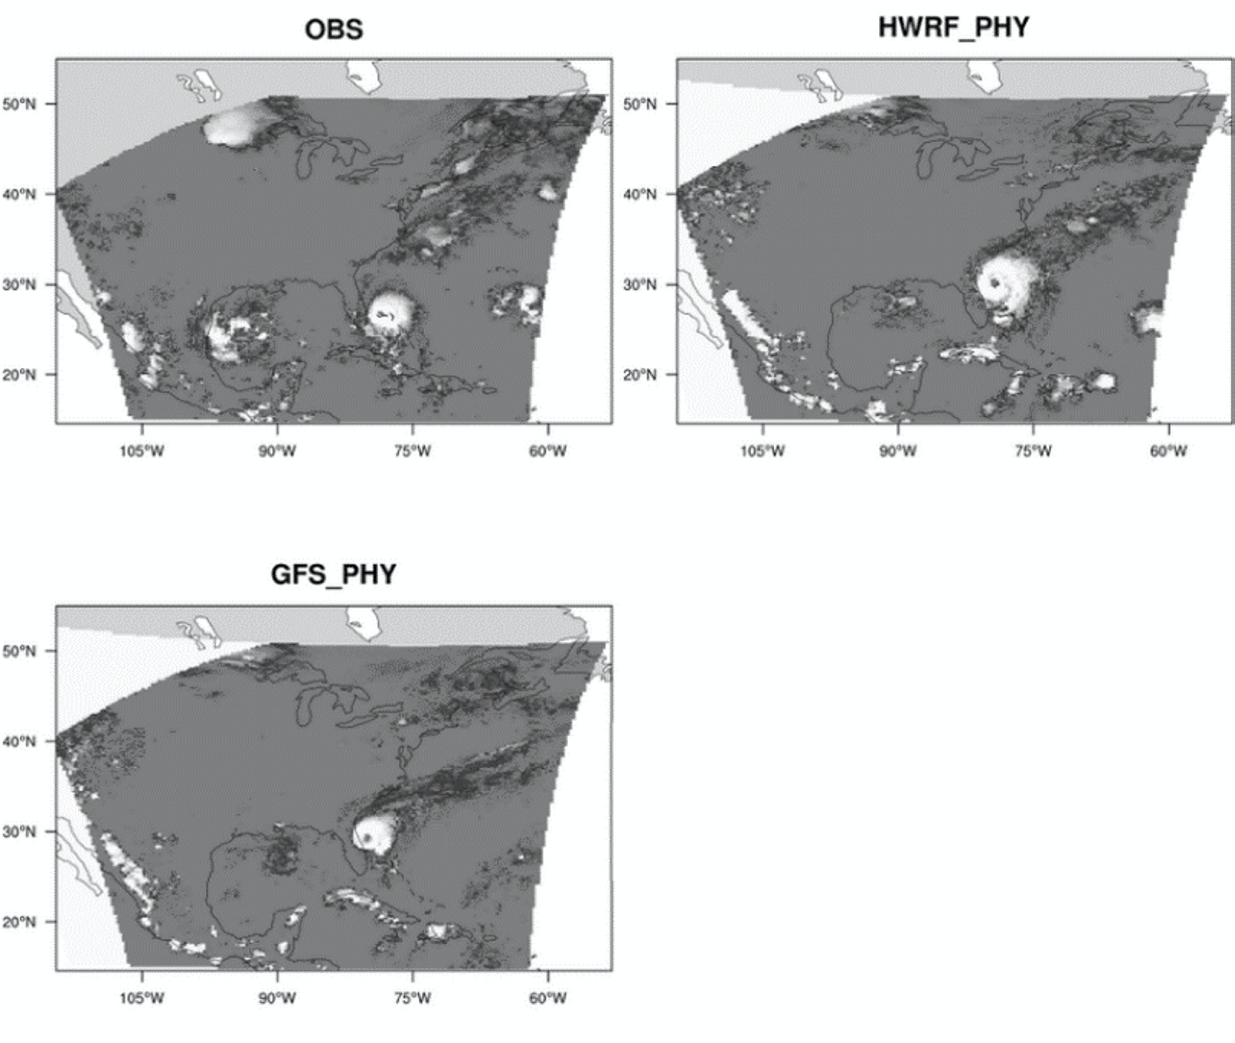
This past year, the DTC team evaluated and tested HAFS with two physics parameterization suites: the NCEP Global Forecast System (GFS) suite and the HWRF suite. The original goal of this DTC Visitor Project was to compare the testing results to observations to determine which physics suite, GFS or HWRF, produces more realistic hurricane structure forecasts. The model synthetic imagery was created by the UFS Unified Post-Process (UPP). Thousands of images were compared, and the results revealed that when the HWRF physics suite was used in HAFS, the model generated exceptionally large hurricane vortices. See the figure below with an example of hurricane Dorian in 2019, located along the US East coast.
The HAFS is being actively developed at NCEP Environmental Modeling Center (EMC). A seasonal test of HAFS (using a highly modified version of the GFS physics suite plus other advancements such as coupling with an ocean model) was performed at EMC in the summer of 2021. EMC suggested that it would be beneficial to the HAFS model development if we could broaden the scope of the DTC visitor project to include the evaluation mentioned above. To accomplish this, we had to develop a standalone software tool to read the model's archived atmosphere profile columns and surface features to create the model synthetic imagery, because the native output files from these tests, which are required for UPP to generate synthetic model imagery, had not been archived. We used Community Radiative Transfer Model (CRTM) v2.3 to transform the model atmosphere properties and the hydrometeor profiles into synthetic model satellite imagery. This time, we focused on comparing the TC inner core (9 deg x 9 deg) against observations. We included the operational HWRF forecast in these comparisons.
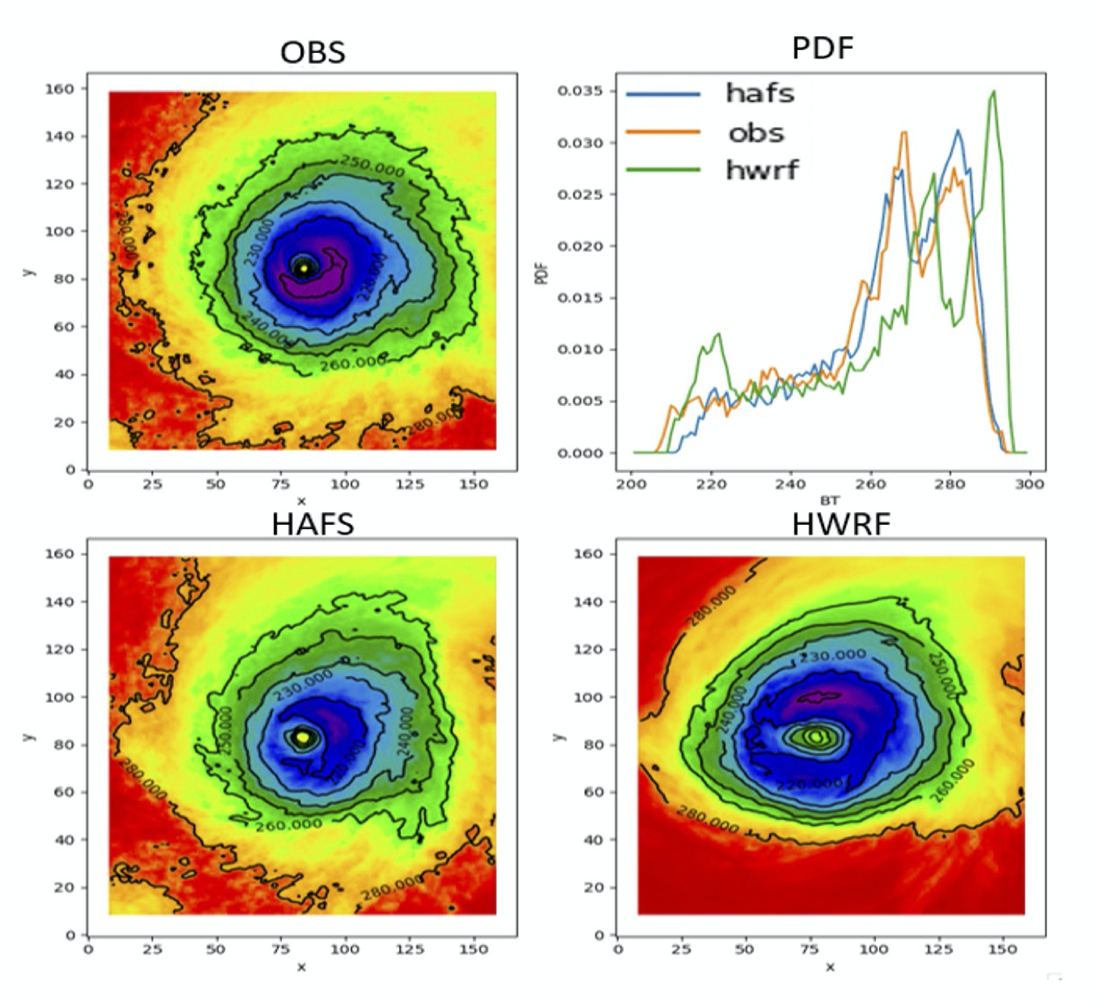
Tropical cyclones Dorian (2019), Laura (2020), and Teddy (2020) were compared. As an example, Dorian's observed and model synthetic imageries from 18Z 2019-08-30 to 18Z 2019-09-06 are combined to form composite imageries; Figure 2 depicts the results. It appears that the HAFS model produced synthetic satellite imagery that was more accurate in terms of size and temperature than the HWRF model. This finding is also clearly demonstrated in the probability density function (PDF), where you can see that the PDF from HAFS and OBS matched well, but the PDF from HWRF result showed a large discrepancy from the other two, primarily because HWRF has a very large fraction in the cold end of the spectrum around 220 K, indicating that the HWRF model simulated a larger and colder vortex than OBS; the inner-core simulated HAFS, on the other hand, is slightly warmer than OBS. These findings demonstrated that the HAFS improved the simulated vortex structure with more realistic size, structure, and brightness temperature.
As a former DTC team member, I've always enjoyed working with DTC colleagues to learn innovative ideas and techniques. Unfortunately, due to Covid-19, this year's visit was virtual, and I missed meeting the DTC team in person. Now, as an associate professor at the Coastal Carolina University's department of coastal and marine systems science, I teach coastal meteorology, hydrodynamics, and oceanography. My research focuses on the air-sea-coupled physical processes that occur in coastal areas during extreme weather events. The DTC software, such as the METplus, UPP, UFS, and CCPP, have been, and I believe will always be, a valuable tool that I use extensively in my research and teaching.