
The Rapid Refresh Forecast System (RRFS) is NOAA’s next-generation high-resolution, rapidly- updating ensemble prediction system that is underpinned by the Finite Volume Cubed Sphere (FV3) dynamical core of the Unified Forecast System (UFS). The RRFS has been in development over the past 5-7 years as part of a major collaborative effort between numerous organizations in NOAA, an ongoing partnership with the DTC, and academia.
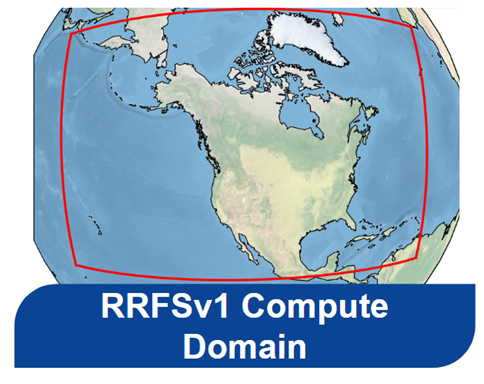
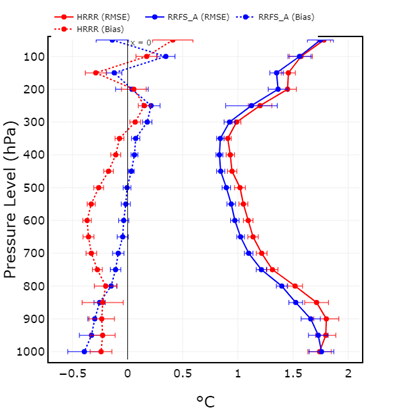
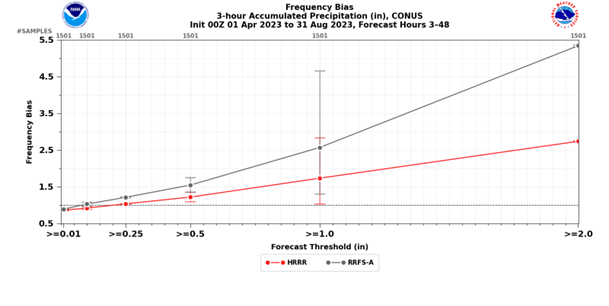
The RRFS must meet or exceed the performance of the current operational high-resolution deterministic and ensemble systems. Accordingly, the RRFS features many ambitious capabilities that set it apart from the present era of high-resolution Numerical Weather Prediction (NWP) systems, such as a large 3-km domain covering all of North America (Fig. 1). So far, its overall performance has been quantitatively promising in the cool season (Fig. 2), but the same cannot be said for warm-season convective precipitation. In these scenarios, the RRFS tends to produce storms that are too intense and have a high bias in precipitation (Fig. 3).
In the Spring and Summer 2023, the NOAA National Severe Storms Laboratory (NSSL) ran several versions of the Model for Prediction Across Scales, or MPAS, using configurations similar to RRFS. The results were impressive, with performance exceeding that of the RRFS for key convective forecast fields. In light of these results, and the continued struggles to improve RRFS performance for convective prediction, NOAA leadership requested a study be performed to review the efforts to address the challenge in the RRFS and recommend a path forward (https://doi.org/10.25923/ccgj-7140).
As a part of this study, a large number of homogeneous and idealized convective simulations were conducted to identify the source of the RRFS bias. FV31 solutions were compared to solutions from well-known convective models, Cloud Model 1 (CM1), and the Advanced Weather Research and Forecast Model (WRF-ARW). CM12 and WRF-ARW were modified to resemble the FV3 configuration as closely as possible. The FV3 was set up to use RRFS settings, and all models used the “Kessler” microphysics scheme.
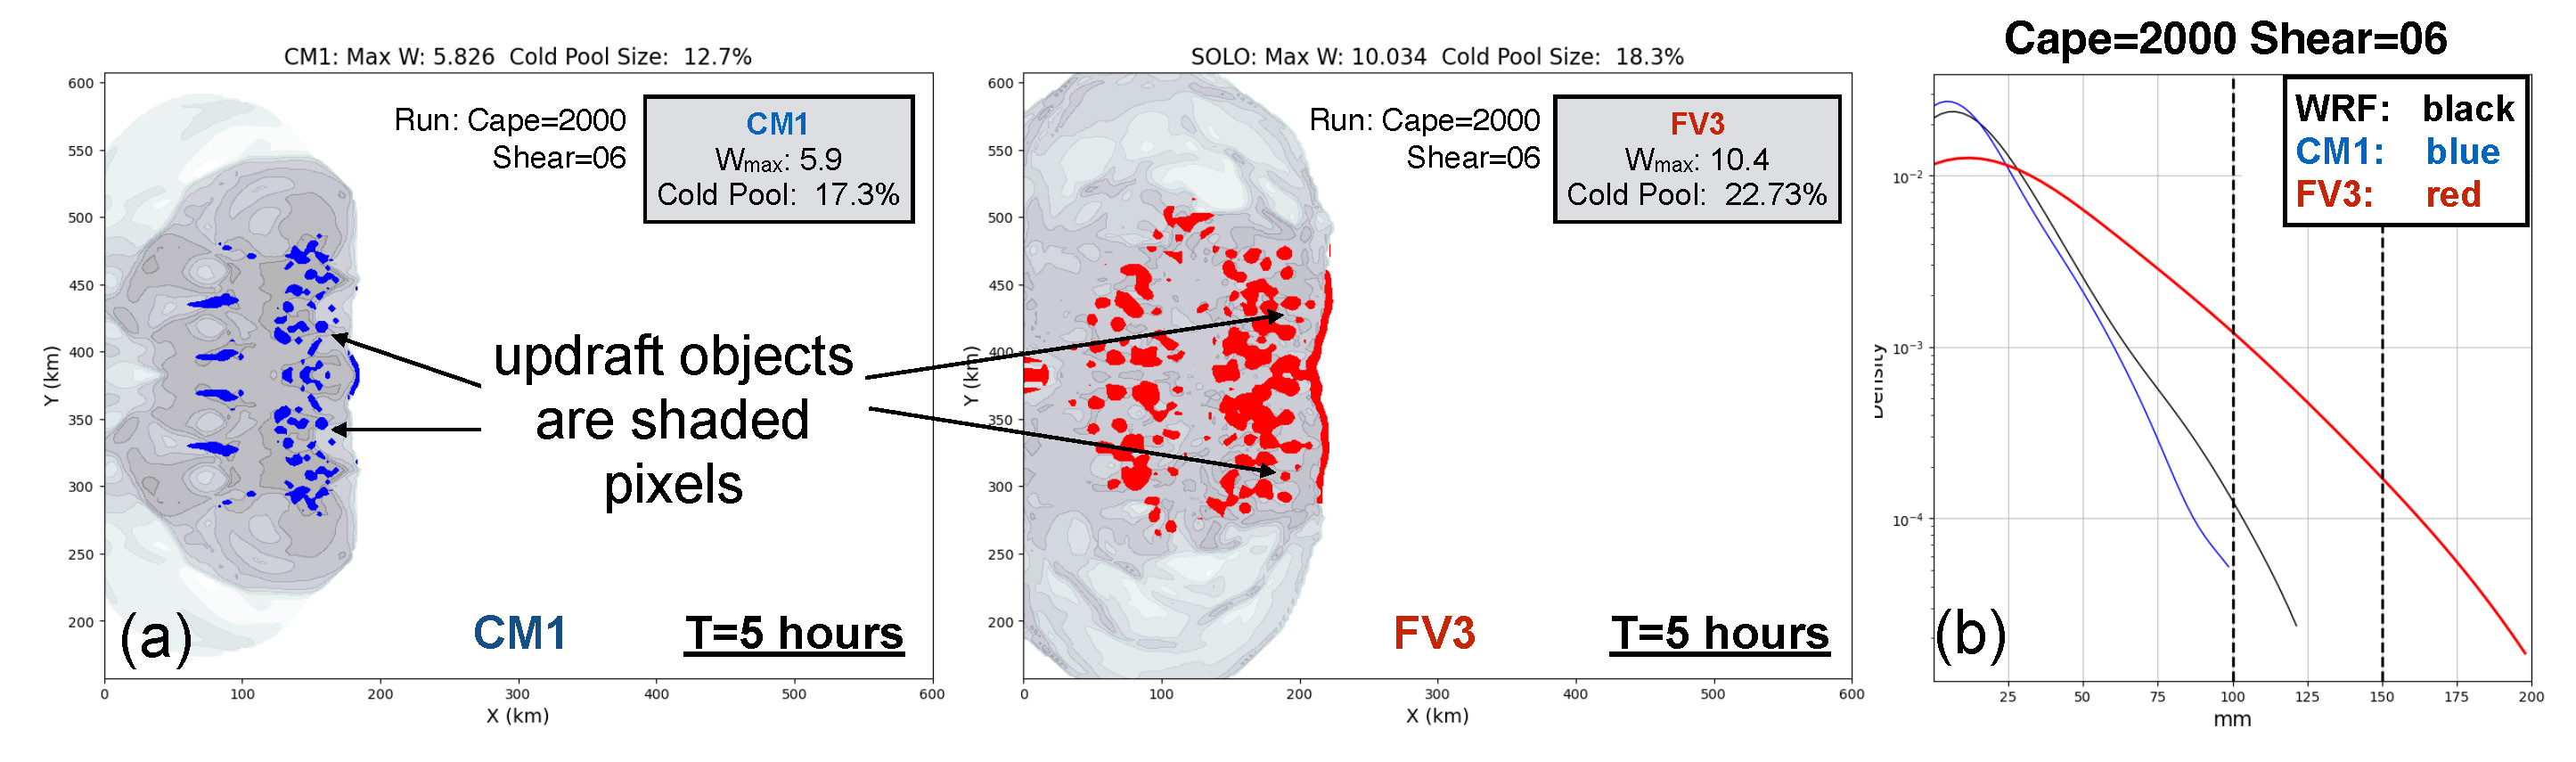
The results shown are from an environment similar to the southeast U.S. summertime environment (moderate Convective Available Potential Energy [CAPE] and low vertical shear). Figure 4 displays the squall-line solutions after 5 hours. The two most noticeable features are the differences in cold pool size (related to the amount of precipitation that evaporates) and the size of the color-filled “updraft objects” (see caption for object criteria). The FV3 solution shows a broader cold pool with larger storm objects than CM1 (ARW not shown). Even with a homogenous environment and very simple microphysics, kernel density estimates (Fig. 4, far right panel) from the accumulated rainfall at each grid point show that FV3 produces many more points with moderate to heavy rainfall above 50 mm. This behavior is very consistent with the full physics NWP results. It strongly suggests that the dynamical core in FV3 is behaving in a fundamentally different manner than CM1 or WRF. FV3’s uses a “D” grid staggering, which has ~½ the resolution of the “C” grid staggering used in CM1, WRF, and MPAS. This likely results in larger storms and excessive rainfall. Unfortunately, the fundamental grid discretization of a model is a core design component that is not straightforward to change.
With the source of the convective storm bias identified and promising results of MPAS in-hand, the study recommends that version 2 of RRFS should transition to the MPAS dynamical core. MPAS features a more favorable C-grid staggering for RRFS applications, has a limited area capability, and presents an exciting opportunity to grow the UFS community.
[1] We employed FV3 SOLO for these simulations. FV3 SOLO is GFDL’s simplified version of the dynamical core. SOLO’s dynamical core is nearly identical to the RRFS model.
[2] “Cloud Model-1” (CM1) is a numerical model for idealized studies and is considered the standard for convective storm research models. It has been cited in more than 350 peer-reviewed published articles in the last decade in 30 different journals.